Service and VPN Server Status
Here you can track the health of all platform services and view real-time statistics for VPN servers
Step 1. Open monitoring
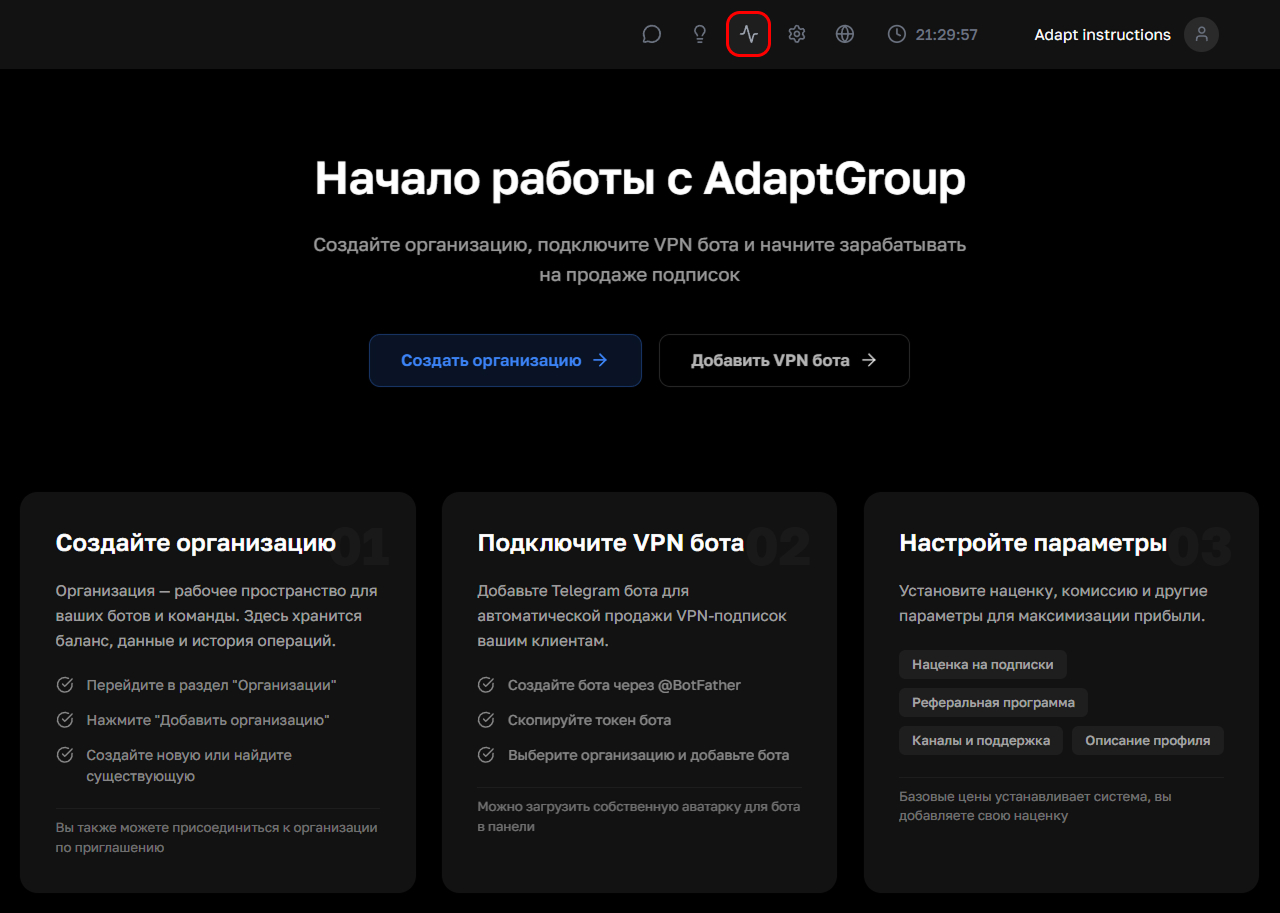
Click on the pulse icon in the top navigation bar
Show screenshot
Step 2. Service monitoring
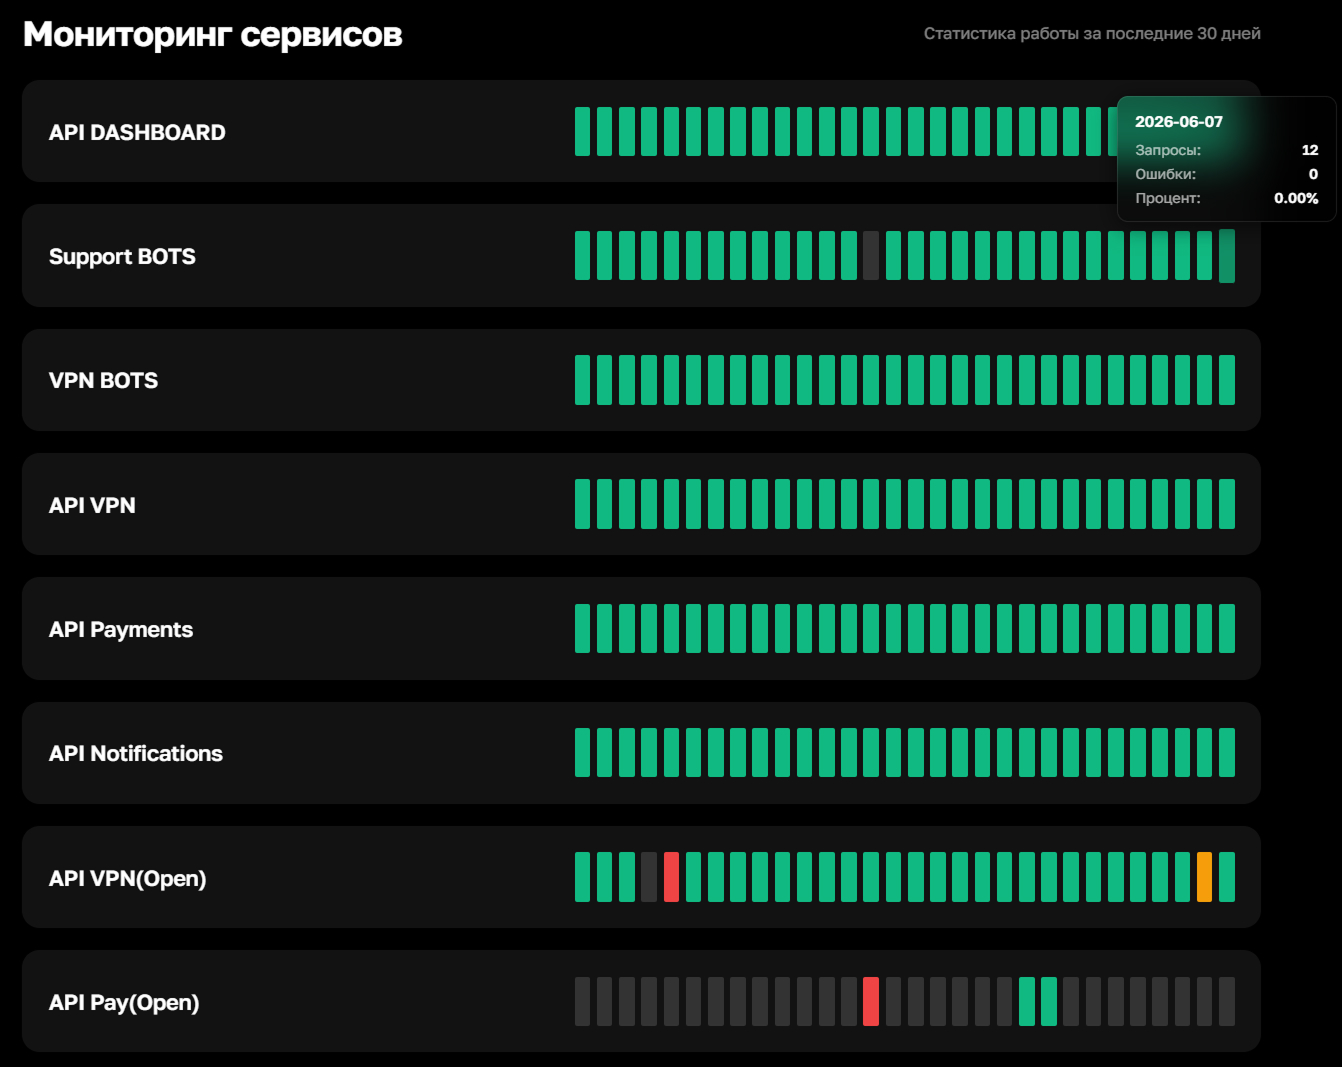
The page shows the status of all internal platform services over the last 30 days. Each service is represented as a row of colored rectangles — green means stable operation, red signals errors, gray means no data for that day, and orange warns of partial outages
If you hover over any rectangle, a tooltip will appear with statistics for that specific date — number of requests, errors and failure percentage
Show screenshot
Step 3. VPN server statistics
Below on the same page is the VPN server section. It shows overall statistics for the entire network — number of servers, locations, online users and total traffic consumed
Each server can be expanded to see detailed information for specific nodes within a location — how many users are connected to each one and how much traffic has been used. Statistics are updated every minute
A green dot next to a server means it's operating normally. A gray dot means the server is temporarily unavailable or not transmitting data